After two years of inertia, small-cap CRE appears to be taking the early lead on a recovery in capital market fundamentals.
Despite prevailing tight lending standards, high interest rates, and growing commercial real estate loan troubles, deal flow ticked up a bit and cap rates have stabilized based on Boxwood Means’ analysis of Q2 small-cap CRE transactions under $5 million culled from CoStar data. The CRE market at large recorded similar nascent progress. Likely factors in this advance include a healthy U.S. economy, lower bond yields, and increased optimism about an interest rate cut this fall. Some green shoots of an improving CRE investment market include the following changes:
-
×
![]()
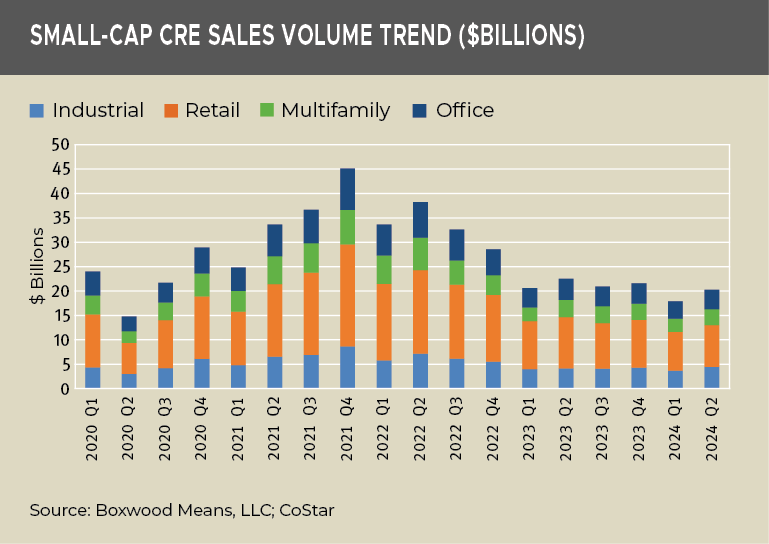
Q2 deal volume increased 13.3% to $20.2 billion across the four major property types. Okay - by no stretch of the imagination is this an especially noteworthy advance since the Q1 comparison period represented the lowest volume since Q2 of 2020 (see the graph nearby). Moreover, deal volume at mid-year was 11.6% behind last year’s pace and 47.0% below recent peak sales during the first six months of 2022. That being said, the Q2 sales total was an unmistakable bump over the $17.1 billion in the average quarterly volume during the two pre-pandemic years (2018-19) when the 10-year treasury rate was roughly half the current rate.
There were volume gains across the board led by a strong 21.3% rebound in industrial sales. Other sector expansions included multifamily (18.7%), office (12.9%), and retail (7.9%).
-
Overall CRE property transactions also revived. Combined Q2 sales rose 23.6% to $55.5 billion with hefty gains posted by multifamily (32.5%) followed by office (30.2%, albeit on historically low, single-digit volume), industrial (24.6%), and retail (5.5%). The very modest uptick in retail sales is likely a supply-scarcity issue since the sector’s robust fundamentals over the last couple of years (excluding malls) has led to intensified investor demand for the product.
While the overall CRE deal volume was positive and roughly on par with the quarterly total YOY, this sum was far below previous results: e.g., trade volume was down 65.7% from two years earlier and 44.5% below average quarterly sales during 2018-2019.
-
×
![]()
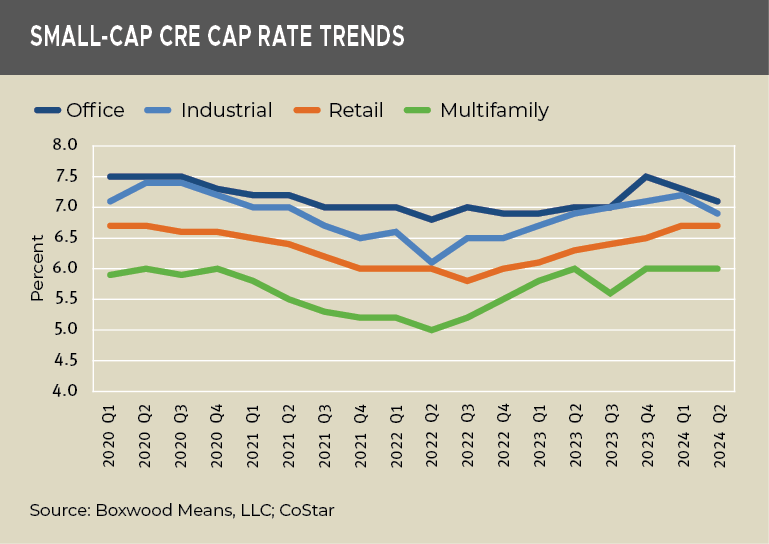
National cap rates for smaller assets have likely reached a cyclical peak. As the nearby graph shows, the overall picture is improving. Average cap rates for small-cap multifamily have flattened at 6.0% for three quarters in a row and, also for two consecutive periods for the retail sector, at 6.7%. Meanwhile, industrial cap rates declined by 30 bps to 6.9% and by 20 bps for office to 7.1%. Notably, cap rates for each sector have clearly leveled out, or are below their respective averages over the past four years.
Though cap rate movements can be tricky to interpret at this juncture, these trending improvements likely redound to the relatively strong small-cap market fundamentals (including near record-low vacancy rates), tightening of the buyer-seller price gap with the uptick in trade volume, and the growing anticipation of a Fed cut in interest rates, among other possible factors.
-
×
![]()
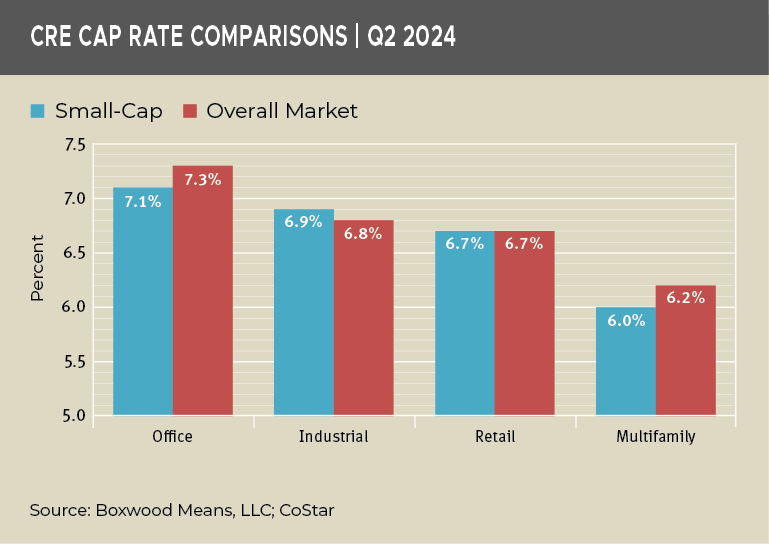
Cap rates for smaller properties continue to defy perceptions of greater domain risk. The rough equivalency between cap rates for smaller properties and the general market is illustrated nearby. In fact, two small-cap sectors (multifamily and office) continued to outperform by 20 bps or more in the latest quarter, underscoring differing – and superior – occupier fundamentals for these property types and in the smaller domain generally. The sizable small business/owner-user base inherent to small-cap CRE also acts as a buffer or stabilizing weight on these asset valuations.
-
Cap rates trends for the national market at large have also stabilized. Multifamily cap rates have hovered at 6.2% between January and June, though the rate is 50 bps above the average over the past four years. At 6.6%, overall retail rates have been relatively flat for three quarters and are within 20 bps of the quarterly average since Q2 2020. Similarly, industrial cap rates were fixed at 6.8% for two quarters and within 30 bps of the four-year low. Lastly, office rates have been fixed at 7.3% since January, 20 bps above the 2020 mark – and, of note, on par with the national average over the past 10 years! Further cap rate inflation here is likely masked by the fact that office transaction volume has plummeted and is near its lowest levels since the GFC because of the extraordinary reset on occupancies due to hybrid work.
Needless to say, there are several wild cards that may affect the CRE investment market over the remainder of the year, from changes in economic conditions, a Fed decision on interest rates, and/or shifts in market sentiment as a national election in the fall nears. Of course, location and asset-specific operating fundamentals can maintain or even elevate property values regardless of broader market movements. All that said, our latest take on CRE investment market trends suggests we’ve surmounted peak cap rates, and that will promote further improvements in deal flow, lower perceived risks, and better pricing transparency.

 Randy Fuchs