Small-cap commercial real estate continued to rebound from its post-2022 slump during the first quarter of 2025. While sales and pricing trends varied by sector, the differences were more a matter of degree than kind. The pressing question: Can this early recovery hold up against ongoing economic headwinds and the uncertainties stemming from new U.S. global trade policies?
Boxwood's Q1 analysis, based on CoStar data for properties under 50,000 sq. ft. (and 5-50 units for multifamily), offers the following insights:
×
![]()
Market-Wide Sales Trends
-
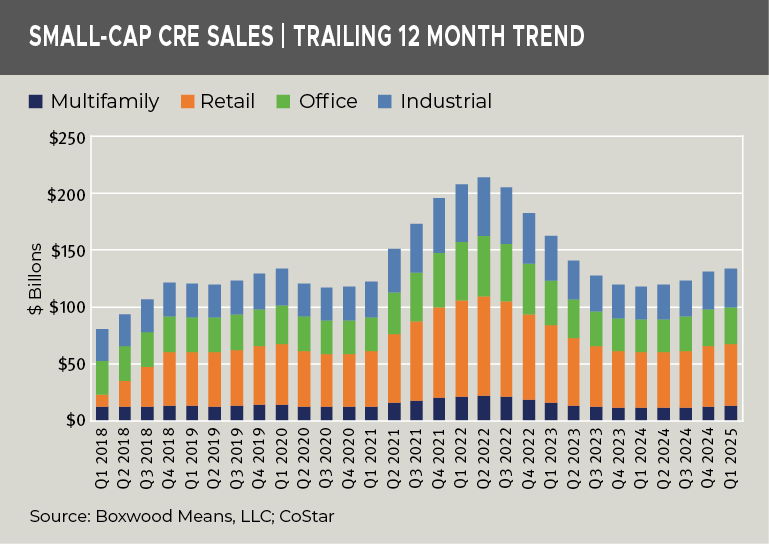
Peak-to-Trough: Aggregate trailing 12-month sales across the four major sectors peaked at $213B in Q2 2022, before dropping 45% to a low in early 2024.
-
Q1 2025 Recovery: Sales rose to $133B over the prior 12 months – up 1.9% from the previous quarter and 12.6% year-over-year from the bottom. (See the nearby graph.)
-
Outlook: The uptick signals an early recovery, suggesting renewed investor confidence and greater capital deployment – assuming a stable macroeconomic backdrop.
Sector-Specific Insights
-
Multifamily: Sales climbed 2.7% to $13.3B – marking a fifth consecutive quarterly gain. Although well below the $18–$22B highs of 2022, volume is up 15.5% from the trough. Small investors are showing renewed interest in assets that averaged just 12 units in the period.
-
Industrial: Trailing sales increased 1.7% to $33.4B – up 14.4% year-over-year. Investor interest remains strong due to tight vacancies in small-bay warehouses and light manufacturing, especially in urban areas.
-
Retail: Still the sales leader, retail volume grew 1.7% to $53.8B – the highest in six quarters. Demand remains steady for local strip and community centers serving essential goods and services. Since the Q2 2024 low, sales are up 10.7%.
-
Office: Small-cap office continues to surprise, supported by stable, lower-cost tenancies and suburban demand. Sales rose 2.2% to $32.7B, a 13.0% gain from the Q1 2024 trough.
Price Trends and Cap Rates
Property Prices
×
![]()
-
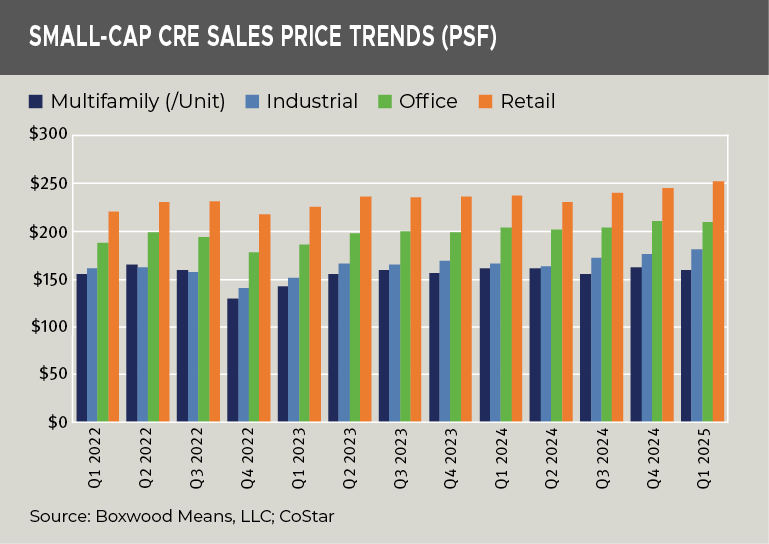
Industrial: Up 3.0% quarter-over-quarter and 8.7% year-over-year, reaching a national average of $182/sq. ft. that reflects consistent supply-demand imbalance. See the nearby graph.
-
Retail: Rose 2.7% for the quarter and 5.9% annually to $253/sq. ft., bolstered by hybrid work-fueled foot traffic in suburban retail hubs.
-
Office: Slipped 0.4% to $211/sq. ft. in Q1, though still up 3.1% YOY.
-
Multifamily: Declined 1.8% to $160/unit – down 1.2% YOY – as investors hesitated amid slow rent growth and elevated borrowing costs. Prices remain 3.6% below post-pandemic highs, while the other sectors are up between 9.3% and 11.6%.
Cap Rates
×
![]()
-
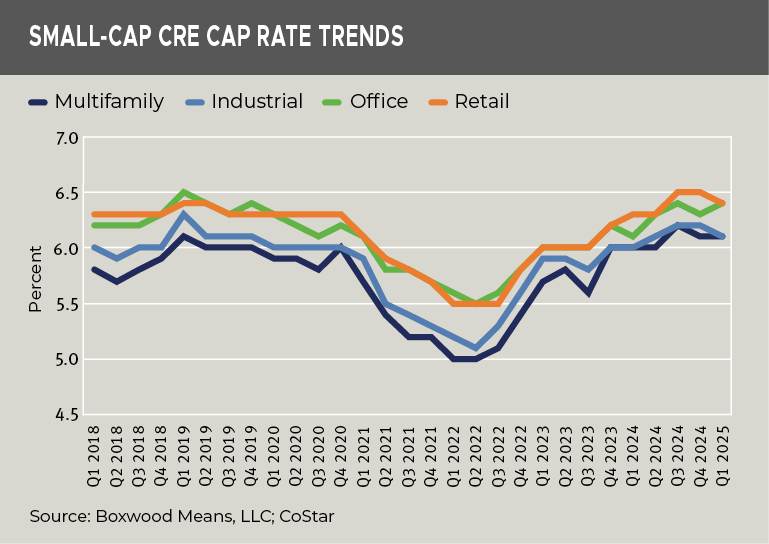
Industrial & Retail: Continued to compress, each falling 10 bps in Q1 to 6.1% and 6.4%, respectively. Still, they remain 100 bps higher than a year ago. See the nearby graph.
-
Multifamily: Flat at 6.1% for six straight quarters, indicating stable valuations after hitting a pandemic-era low of 5.0%.
-
Office: Rose 10 bps to 6.4% – the highest since 2019 and 30 bps above year-ago levels, tracking the sector’s pricing volatility.
Conclusion
While the industrial and retail sectors lead the recovery in both price growth and cap rate compression, multifamily and office markets are recovering at a slower pace. Still, the acceleration in transaction activity across all sectors suggests building momentum. However, the broader CRE outlook remains murky, clouded by shifting U.S. trade policy and rising uncertainty around interest rates.

 Randy Fuchs