×
![]()
With $108 billion of closed small-balance commercial loans during the first half of 2018, the SBL market is on pace to exceed the $200 billion level for the sixth year in a row. Yet investment fundamentals are beginning to fade and market risk is ticking up with higher interest rates, peak asset prices and intense competition for loans. Together these factors may challenge this positive outlook or, worse, signal an end to the current cycle.
Also, and reminiscent of conditions from a decade ago, you know the SBL market is ripe for a change when intense lender competition causes spreads to substantially thin out, LTVs expand and interest-only periods flourish, and solid credits just get much harder to come by.
But it's not yet the end of the party, and there is still room for national and regional lenders to succeed with perhaps more prudent or less risky strategies that might start with better targeting of the strongest geographical markets. In the SBL space, it's not surprising that origination volume is closely aligned with the most populous U.S. states. The top SBL markets include (in rank order of population size) California, Texas, Florida, New York, Pennsylvania, Illinois and Georgia, plus the states of New Jersey, Washington and Colorado. These 10 states account for a disproportionate share of closed loans averaging 65% of total SBL originations or roughly $150 billion over the last three years ending 2017. This amount was nearly double the volume of the balance of states on a consistent annual basis.
A sizable difference in state-level economic activity, resulting from the relatively high number and size of large metropolitan areas in these leading states, largely explains their outsized sum of originations. And it’s these geographical concentrations of economic well-being and growth where lenders will be better off plying their trade during riskier lending periods.
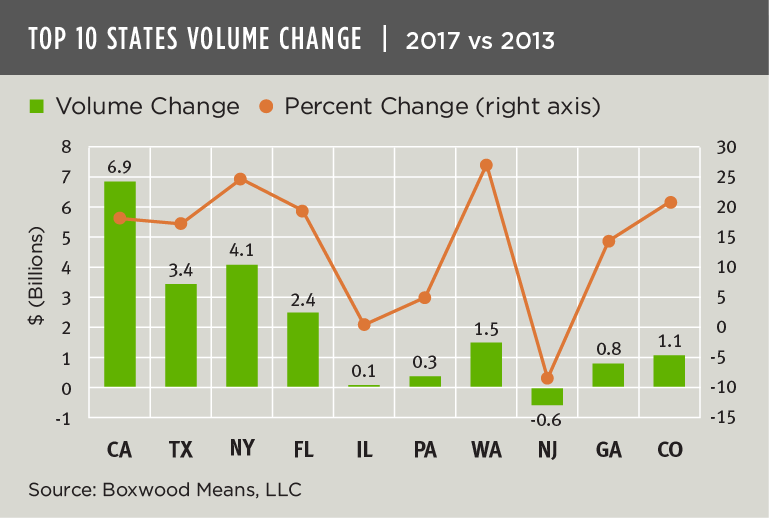
As the nearby graph shows, it's not just the absolute increase in loan volume over time that warrants consideration when targeting markets but, also, the relative rates of growth. For example, though Washington and Colorado trailed some of the others in terms of the change in gross dollar volume between 2013 and 2017, they clocked in with two of the best YoY percentage gains among the top 10 states. Not coincidentally, Washington and Colorado also generated two of the best compound annual growth rates in state GDP over the five-year period according to BEA. By contrast Illinois and New Jersey, which posted flat to slightly negative growth in dollar loan volume between the two years, respectively, also generated GDP growth below the U.S. average over the five-year period.
During the market's expansion, small-balance lenders and investors found safe bets in a myriad of places throughout the U.S. But lending markets built on the strongest economic foundations will typically offer investors more shelter from a future storm.


