Occupier fundamentals retreated slightly for small-cap CRE during the first quarter but, even so, smaller CRE assets sustained a sizable leasing advantage over the commercial real estate market at large. This outperformance supported stronger capital market fundamentals as well.
First quarter statistics drawn from Boxwood’s analysis of national CoStar data that captures leasing and investment-related activity for small office, industrial, and retail properties under 50,000 sq. ft. include the following highlights:
-
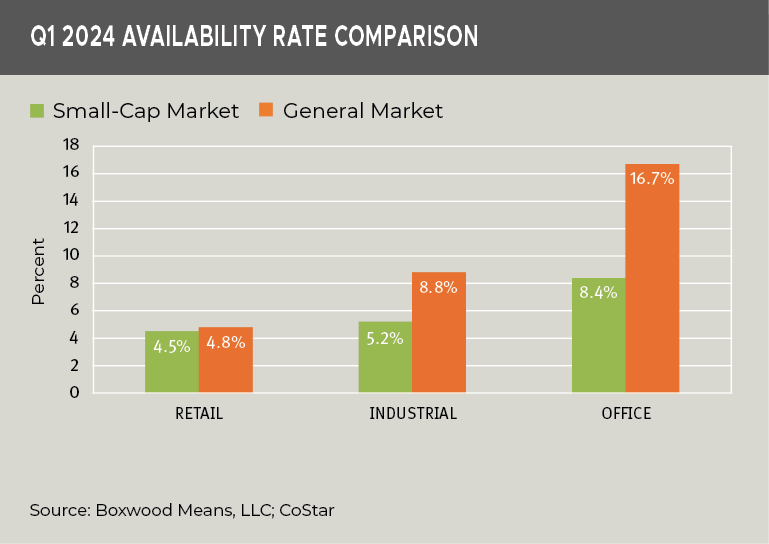
Tight Space Markets Still Govern. Soft demand pushed up overall vacancies across the property sectors, but space for lease remained constrained by historical norms. Granted, the aggregate availability rate for small caps rose 20 bps to 5.7%. But the national rate hovers within 70 bps of an all-time low attained two years ago. Individually, too, small-cap CRE availabilities for retail (4.5%) and office (8.4%) buildings were just above record lows by 10 and 40 bps, respectively. On the other hand, industrial availabilities (5.2%) notably have increased 140 bps after setting an all-time low in mid-2022.
×
![]()
Despite the modest occupancy declines, the contrast between the small-cap domain and the general market couldn’t be starker. As the nearby graph shows, the Q1 spread in availability rates ranges from 30 bps (retail) and 350 bps (industrial) to a huge 830 bps (office). These disparities suggest, generally speaking, that the underlying operating fundamentals and income for small-cap commercial properties are likely to be comparatively more reliable and stable.
It would come as no surprise then if, with conservative underwriting at loan origination, the DSCR and LTV metrics for the underlying collateral on small ticket deals are holding firm relative to many large, institutional assets facing over-supply (e.g., industrial, apartment) or an upheaval in traditional occupancy patterns (e.g., office).
-
Retail Retains the Crown. With retail sales jumping 3.3% YOY through March, it’s clear that consumers have continued to open their wallets despite higher prices. This spending splurge has been a boon for retailers and the retail space markets writ large and, as previously reported here, gave cause for retail investors to turn from bears to bulls.
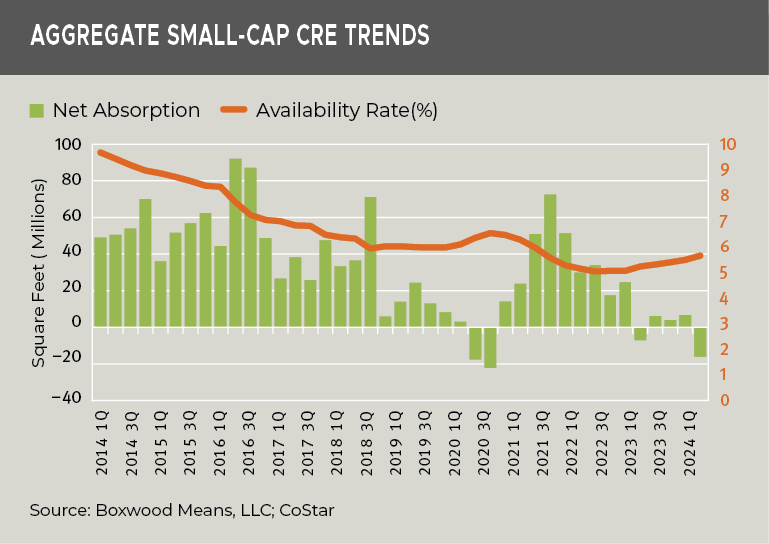
Meanwhile, a trivial loss of 120,000 sq. ft. of small retail occupancies during Q1 fails to overshadow a remarkable trend of 13 consecutive quarters of positive net absorption, amounting to a whopping 177 million sq. ft. of occupancy gains since the end of the pandemic lockdowns (Q3 2020). Both the national small-cap retail availability and vacancy rates are within 10 bps of their historical lows and roughly 200 bps below long-term averages.
Costar reported that much of the retail leasing activity has been concentrated in small spaces under 2,500 sq. ft., and the firm attributed this trend substantially to growth in quick-service restaurants, other food and beverage sectors, and personal services. In fact, CoStar noted that space availabilities were negligible among most multi-tenant, retail segments including strip and power centers.
That being said, since the pandemic and post-pandemic jolt to income and savings has now largely dissipated, questions have surfaced over the sustainability of U.S. consumer spending. Without that unprecedented buffer, the continued strength of the retail space markets will vitally depend on enduring healthy labor market and wage growth and further dips in inflation.
×
![]()
-
Industrial Demand Tanks. The streak of negative net absorption for small-cap industrial extended to five quarters with a massive loss of 13.3 million sq. ft. during Q1, the largest market giveback since the Great Recession more than 14 years ago. The pullback in leasing links to continued weaknesses in manufacturing and inventories, some of which is associated with the multi-year lows in the U.S. residential housing market that fuels demand for furniture, building materials, and appliances. Notably, industrial’s sizable occupancy losses represented over 80% of the Q1 negative net absorption across the three sectors (followed by the office sector contributing another 16% of the losses). See the nearby graph.
-
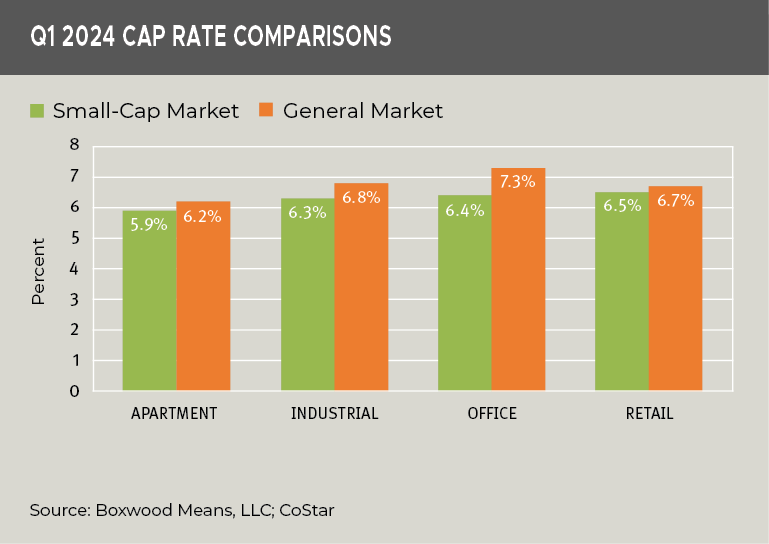
Cap Rate Spreads Defy Typical Risk Profile. Investors have traditionally assigned higher cap rates to different types of smaller CRE assets because of the higher perceived risk and ultimate value of holding such investments versus large-cap properties. Yet, the most recent transaction data turns this premise on its head. Cap rates for smaller assets (sold below $5M and less than 50,000 sq. ft. or 5-40 units) were lower than prevailing rates in the general market (see the nearby graph). For example, small-cap office and industrial sectors show gaps of 50 bps or more with small differences for apartment and retail.
×
![]()
Some of this cap rate outperformance is tied to the tighter leasing conditions for smaller commercial buildings noted above. Other factors include the smaller domain’s sizable percentage of owner-occupied properties, countless numbers of small, triple-net franchise deals with credit tenants, and the tendency of small investors and operators to hold their assets long term.
The above statistics and trends point to a recurring theme on these research pages. That is, smaller CRE assets can be a relatively consistent and durable store of value for lenders and investors when the due diligence tasks and techniques supporting acquisition and loan transactions are thorough and sound. Chances are then that, amidst challenging capital market conditions, small-balance portfolio loans are, in the main, performing just fine.

 Randy Fuchs