Small cap CRE sales recovered in 2024, showing that investors were adjusting to the market reality of higher interest rates. Sales prices also rose, and most property sectors found a cap rate floor.
Boxwood’s year-end findings derived from CoStar data on commercial property sales under 50,000 sq. ft. (and 5-50 units for multifamily) are summarized below.
×
![]()
Market-Wide Sales Trends
-
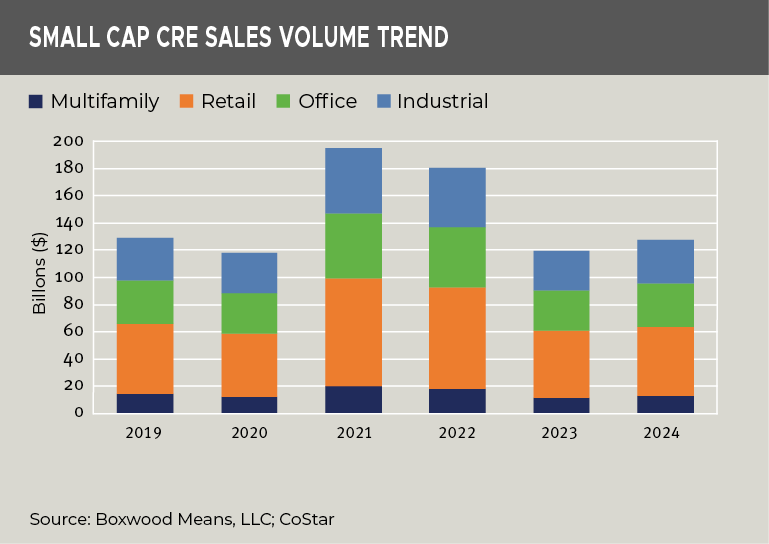
Recovery After Decline. After the post-pandemic surge in deal volume, small cap CRE sales fell 33% in 2023 with rising interest rates, financing challenges, and economic uncertainty. However, sales recovered by 6.9% in 2024 to nearly $128 billion. Multifamily led annual growth (11.3%), followed by industrial (10.6%), office (8.2%), and retail (3.0%). See the nearby graph.
-
Approaching Pre-Pandemic Levels. Sales remained 1.2% below 2019 levels, but the market’s resurgence suggests the worst of 2023’s slump has passed.
Sector-Specific Insights
-
Multifamily Demand Driven by SFR Affordability Issues. Sales rose to $12.8 billion reflecting a rebound from a 2023 correction caused by an unsustainable, post-pandemic housing demand surge. Rising single-family residential prices, low SFR inventory, and elevated mortgage rates were major drivers behind the renewed multifamily investor demand. Still, sales remained 9.9% below their level six years ago.
-
Steady Industrial Demand. With $32.3 billion in sales, industrial was the sole sector with net growth (3.5%) versus six years ago, thanks in part to demand for small-bay warehouses used for last-mile logistics use as well as buoyant U.S. light manufacturing growth. Property sales are still way off their 2021-2022 high water marks, but deal volume appears to have returned to sustainable levels.
-
Small Office Assets – A Breed Apart. Office sales reached $31.5 billion, largely supported by suburban office buildings catering to small tenants on relatively short-term leases, and hybrid workers. Historically low vacancy rates contrast with struggles among large office assets in CBD locations.
-
America Shops Local. Retail sales hit $51.2 billion, maintaining the sector’s perennial 40% share of total small cap CRE sales. Investors have flocked to well-performing retail niches as flexible work schedules have driven more traffic to strip and neighborhood/community centers. Despite the rise in e-commerce, this is where consumers buy everyday items. Space for lease remains scarce as these open-air shopping centers carry extremely low vacancy rates and there’s little new supply coming online.
×
![]()
Price Trends and Cap Rates
-
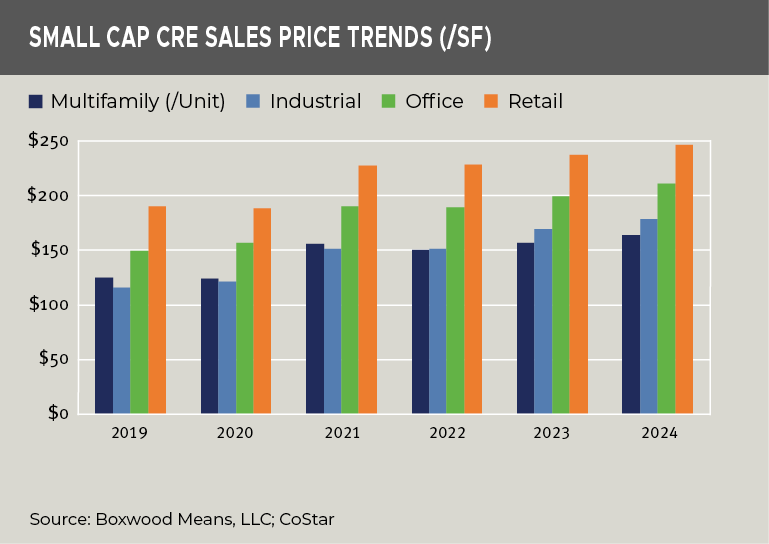
Consistent Price Growth. Since 2019, prices rose cumulatively across all sectors led by industrial (54.4%) and followed by office (41.1%), multifamily (31.3%, and retail (29.6%). (See the nearby graph.) Annual appreciation last year fluctuated within a narrow band of low single-digit growth. At year’s end, retail was priced at $246 /sq. ft., followed by office ($211), industrial ($179), and multifamily ($164 per unit).
-
Slim Retail Price Gain Counters Vast Appeal. Open-air centers are the cat’s meow of late, so retail’s low 3.7% price increase YOY relative to the other sectors may seem like a head-scratcher. With typically longer-term leases, though, stable returns tempered rapid appreciation of strip centers and neighborhood shopping centers. Also, these assets are often purchased by small private investors, suggesting that asset prices move at a slower, more localized pace rather than being driven by massive capital inflows associated with large institutional buyers.
-
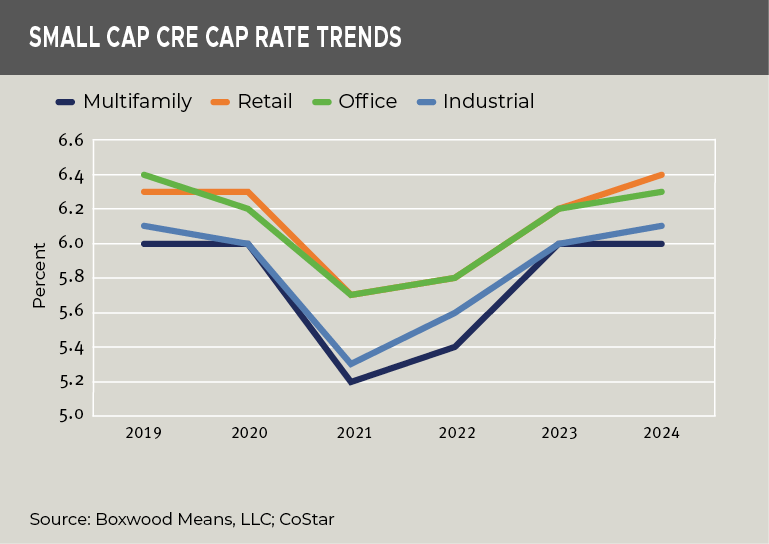
Cap Rate Adjustments. Multifamily and industrial sectors witnessed the sharpest cap rate swings from earlier boom times. Since 2021, multifamily and industrial cap rates rose 80 bps to 6.0% and 6.1%, respectively, last year. Even so, it’s noteworthy that these two elevated, year-end cap rates were on par with 2019 levels. See the nearby graph.
Meanwhile, retail ended at 6.4%, up 20 bps YOY, and reflecting the asset’s relatively weak price appreciation. Office cap rates increased 10 bps to 6.3% but remained 10 bps lower than pre-pandemic. At this level, it’s clear that investors remain cautious amidst leasing uncertainties for the product type writ large, despite the fact that small office properties have generally outperformed their bigger and mostly urban counterparts for many years running.
×
![]()
Conclusion
Investors slowly adjusted to the new normal of higher debt costs last year, driving small-cap CRE sales growth and potential cap rate stabilization, especially for multifamily and industrial sectors. Modest across-the-board price appreciation reflects growing yet conservative investor demand rather than an expansive, high-risk appetite.

 Randy Fuchs