Steve has performed CRE investment analysis and property valuations for more than 20 years. He joined Boxwood in 2015. Steve earned early skills in market research, site selection, and property due diligence as a consultant for major regional and national retailers.
Over the past 10 years or more, commercial real estate lenders have grown increasingly comfortable with the appraisal industry practice of integrating a property inspection by a qualified third party into a remotely generated or desktop commercial appraisal or evaluation report. This bifurcated approach has proven to be very cost effective for lenders and typically renders reliable estimates of market value to boot. Yet the question of valuation reliability remains paramount and, to a great extent, turns on the capability of the analyst/appraiser to ascertain and quantify – from a geographical distance – the differences between a subject property and comparable properties under the sales comparison approach. In other words, distinguishing location quality is often a vital task at hand.
Of course, the first step is to identify closed sales that are physically similar to the subject property (e.g., in terms of property type/subtype, building size, year built, lot size, etc.) and, coupled with proximity and recency of sale, represent suitable or “good” comps. But these building and site characteristics don’t take specific neighborhood attributes into account such as local demographics, home values, traffic counts, local businesses, nearby amenities, and points of interest among other variables. These factors often have a major impact on location quality and, as a result, relative property value.
Among Boxwood’s analysts and appraisers, adequately distinguishing the location of a subject from selected comps solves what we call the ‘other side of the tracks’ issue and demonstrates our geographical competence in performing FieldSmart Evaluations on a nationwide basis.
As commercial property evaluators, we rely heavily on external/third-party resources to differentiate locations. For starters, we employ a third-party property inspection firm with field agents nationwide as our substitute for having “boots on the ground.” These certified field agents furnish Boxwood with a comprehensive property and site inspection report highlighting property conditions and features, any site risks or caveats, along with a synopsis of local market conditions that offers insight into how a given market is behaving.
While these third-party inspection reports are helpful, our final determination of – and adjustment for – property location quality hinges on an accurate analysis of the comps’ neighborhood attributes and their corresponding impact on current use and value. For example, when we examine an industrial distribution warehouse location, it’s a relatively straightforward exercise to calculate the proximity of the subject and comparable warehouse properties to a major highway/interstate that affords valuable tractor trailer accessibility.
On the other hand, evaluating a retail property and its comparables are another kettle of fish. Retail users often find sites most desirable along arterial corridors with high traffic counts (think: good exposure/visibility), corner signalized site influence (for easy accessibility), and close proximity to national retailers (which provide customer draw). When selecting retail sites, several national retailers and chain restaurants will also require certain site qualities and demographics within the trade area; e.g., when Family Dollar selects a site in a rural or small town location, their preferred location factors and demographics include easy ingress/egress, ample parking, highly visible strip centers with strong traffic counts, population of at least 6,000 residents within a 5-mile radius of the subject property, and average household income levels up to $50,000. The differences in such neighborhood variables between the retail subject and its sales (and/or rent) comparables can have a profound impact on our analysts’ adjustment for location quality.

×
![]()
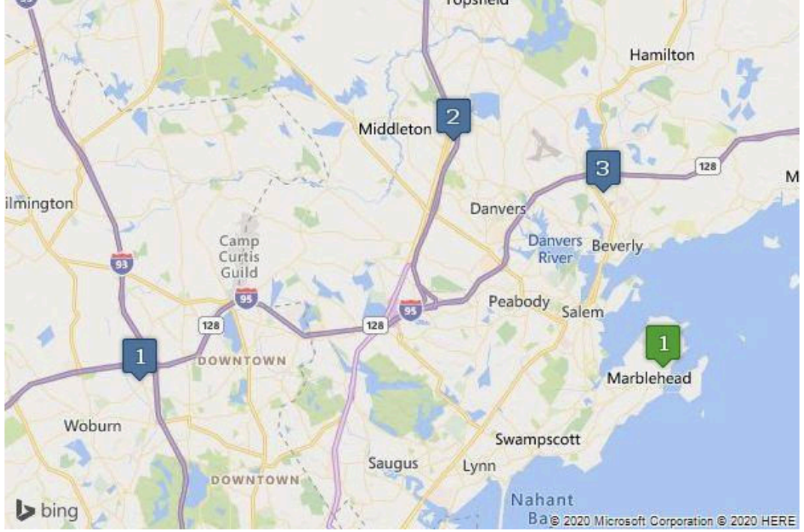
Finally, a more specific example can shed a bit more light on Boxwood’s general process for analyzing locations with the sales comparison approach. Let’s assume that we have a subject property (general office) located in Marblehead, MA. We have selected comparable sales in three different towns including Woburn (Comp 1), Middleton (Comp 2), and Danvers (Comp 3). See the town locations on the nearby map.
When comparing these locations, we will consider the physical position of the properties and, also, examine local demographics to determine which of the comps may be in superior/inferior locations. Here, we have focused especially on median household income and median home values since these factors are often a good indication of the affluence and, by extension, relative location quality of any given community. By examining the map and demographic statistics in the table further below, we can clearly see that median household income and median home values for Woburn (Comp 1) and Danvers (Comp 3) reflect significantly lower dollar amounts and will thus rate inferior in terms of location quality compared with the (upscale) Marblehead property. Such inferior location ratings would, in turn, warrant a +10% adjustment in order to normalize the sales prices of these two comps to the subject. The Middleton property (Comp 2), with only slightly inferior values, would receive a +5% adjustment.
×
![]()
The above analysis is for representative purposes and, as such, only considers a couple of demographic variables. As mentioned earlier, because of the growing wealth of third-party data sources available to industry players, we can harness a diverse set of neighborhood factors when adjusting for the ‘other side of the tracks’ issue depending on property type and use. And, of course, location quality is just one of a series of physical, site, and locational attributes that Boxwood real estate analysts and appraisers examine with the sales comparison approach to value.


 Steven Makowski, Managing Director-Valuations
